




Last updated:
POM material shrinkage is the decrease in size from a mold cavity to a cooled molded part. Measure both at stated conditions. Start with data for the exact resin grade, then check the sizes that matter in a controlled part trial.
A part can match one drawing size and still fail to fit. Has that happened in a tool review? The missing detail may be the test direction, the time of the size check or the state in which the part must pass. Use this guide to read the grade data, work through the math and build a trial record.
Key Takeaways
- A grade sheet gives test-specimen data. It cannot guarantee an allowance for every tool feature.
- Record flow direction, test conditions and time since molding beside each result.
- Separate mold shrinkage from later size change and warpage.
- Check a resin change with part readings and fit tests before release.
What POM Material Shrinkage Means for a Finished Part

Cavity dimensions versus measured part dimensions
For linear shrinkage, compare a known cavity length with the same length on the part. State the test conditions for both. Cooling can reduce size without a loss of mass. Here, size change is what you need to track.
POM, also called acetal, is a semicrystalline thermoplastic. This means that some of its chains form ordered regions as it cools. Both cooling and crystal growth affect the final size. The Delrin technical molding guide treats shrinkage, process conditions and dimensional stability together, rather than offering one universal correction factor.
An outside length, a bore and a rib spacing are separate features. Mark each on the drawing and note the local flow direction. A core or rib can restrain how the part shrinks. Don’t assume that a simple test strip predicts that shape.
If you are still choosing the material family, review POM homopolymer versus copolymer first. Once the family is selected, work with the exact grade and color designation.
Mold shrinkage, later shrinkage and service conditions
Keep three questions separate. What size is the part at the agreed first inspection? Does it change during later storage or thermal exposure? What size is required in service?
Post-molding shrinkage means further shrinkage after molding. Heat and moisture can also change a later size reading. Record the part’s history and its state when measured. Without those details, one reading cannot show which effect caused the change.
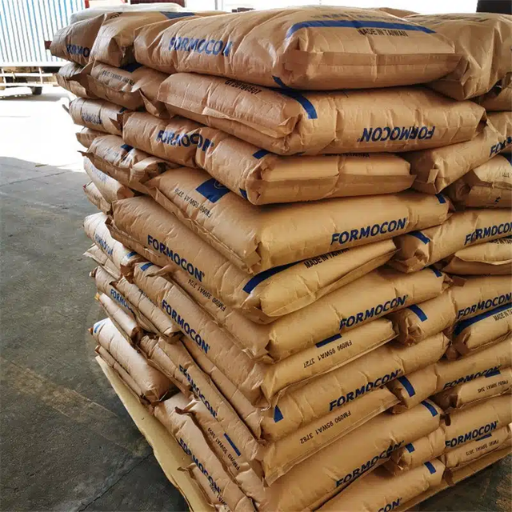
Before asking about resin, name the exact grade and mark the features that must fit. Use the site’s POM material options as a starting point, and ask for the current grade sheet. A resin photo or family name cannot tell you how much allowance the tool needs.
Read POM Material Shrinkage Data Before Choosing an Allowance
Grade and test direction belong beside the number
The Delrin 500CPE product data sheet provides a useful example of why the full designation matters. Its comparison columns give the following mold-shrinkage values under ISO 294-4:
| Exact designation in the sheet | Parallel to flow | Normal to flow | Method |
|---|---|---|---|
| Delrin 500 NC010 | 2.1% | 2.0% | ISO 294-4 |
| Delrin 500P NC010 | 2.0% | 1.9% | ISO 294-4 |
| Delrin 500CPE NC010 | 2.0% | 1.9% | ISO 294-4 |
These values apply to the named grades. Equal entries do not prove that the grades are the same, are in stock or will act alike in your tool. Keep the test setup beside the number. If the source leaves a field blank, write “not stated” and ask for it.
The legacy Celcon processing guide, chapter 3, illustrates the laboratory-to-part gap. It reports a 1.2-2.4% range for standard unfilled specimens and notes actual-part shrinkage observed as high as 3.7%. Those observations are neither a universal POM range nor an upper design limit.
For the broader selection decision, use the separate POM injection-molding grade guide. Here, the question is narrower: what evidence supports this grade’s dimensional trial?
Why filled grades and color changes need their own evidence
The BASF Ultraform brochure compares parallel and perpendicular behavior for unreinforced, glass-fiber and mineral-filled grades. Its graphs reinforce the need to preserve direction and test conditions. They don’t justify assigning every filled resin a single lower allowance.
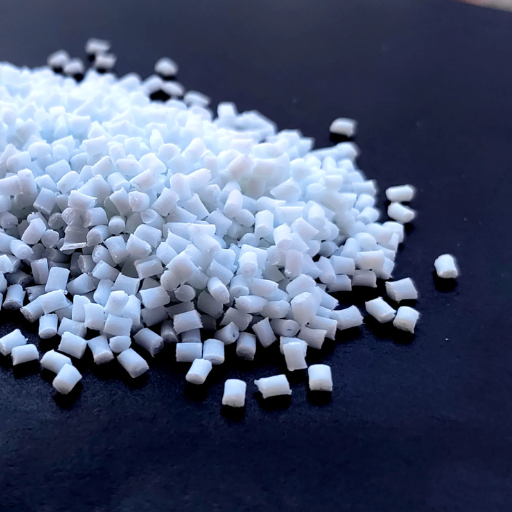
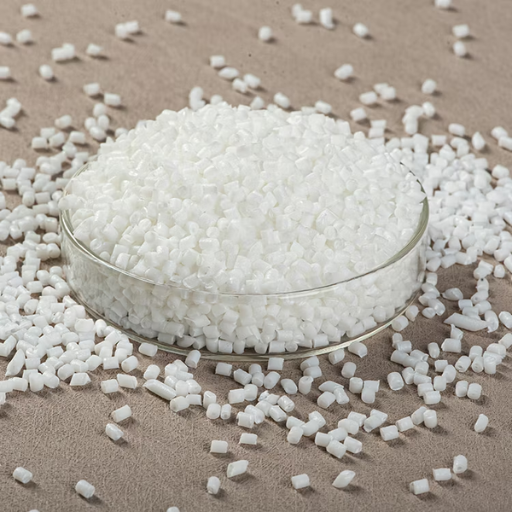
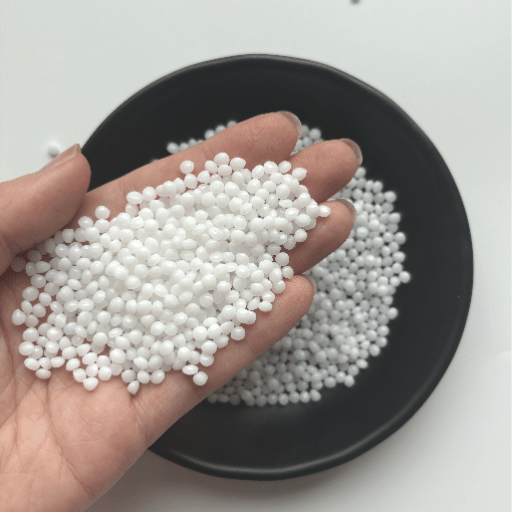
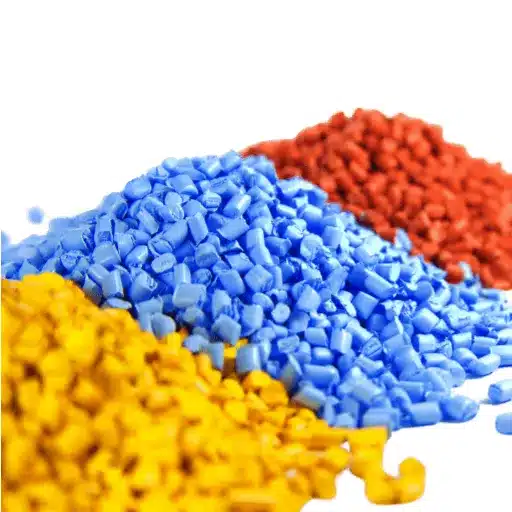
Check the data and trial scope when the color or additives change. You can’t identify a resin recipe by looking at its pellets. Color alone does not prove what an unknown sample contains.
Illustrative scenario: A buyer proposes a replacement with a similar flow value. Is it a direct substitute? The team first asks for its own grade sheet, full color code and shrinkage in both directions. Before any pass decision, the team must judge whether these records are enough to plan a fair test.
Measure POM Molding Shrinkage with a Traceable Worksheet

Define the dimension and reference condition
Pick the feature and direction before taking readings. Choose a datum: the point or surface used as a reference. Agree how to support the part, which gauge to use and when to check it. A bowed part can seem to change length if the gauge forces it flat.
ISO 294-4:2018 addresses molding and post-molding shrinkage of injection-molded thermoplastic test specimens, parallel and normal to flow. Its public scope distinguishes these measurements from moisture uptake effects. ASTM D955-21 also cautions against using standard-specimen results to predict absolute shrinkage in parts with different geometries and processing conditions.
These public summaries explain what the methods cover. They don’t give the full test steps. If a contract calls for either standard, obtain the full method. Agree the plan with the lab that will run it.
Calculate shrinkage and invert the formula carefully
For a simple linear comparison on a cavity-length basis:
S (%) = (Lc – Lp) / Lc × 100
Lc is the cavity length. Lp is the measured part length. Use the same units and state the test conditions for each. To work back from a target part size, use the fraction s = S / 100:
Lc = target Lp / (1 – s)
Illustrative scenario: A 100.00 mm cavity produces a spacer measured at 98.00 mm under the chosen inspection conditions. The calculation is (100.00 – 98.00) / 100.00 × 100 = 2.00%. If a hypothetical target part length is 100.00 mm and the same 0.02 fraction is assumed, the inverse gives 100.00 / 0.98 = 102.0408 mm.
The second result shows the math; it does not tell you how to cut the tool. It assumes the same shrinkage fraction still applies. It cannot predict holes, warpage or shrinkage held back by a core or rib. The extra decimal places do not set a machining tolerance.
Complete the trial record before comparing results
Use a record that connects each measured part to its molding history:
| Record field | What to capture |
|---|---|
| Material identity | Maker, full grade, lot, color and dated grade sheet. |
| Tool and feature | Tool/cavity ID, cavity size, drawing datum and wall section. |
| Direction | Along flow, across flow or the stated feature direction. |
| Heat | Actual melt and mold temperatures; where each was checked. |
| Packing | Pressure units and basis, hold profile and gate-seal check. |
| Cooling and release | Cooling and ejection setup; any visible shape change. |
| Size check | Time since molding, test temperature, storage, gauge and support. |
| Results | Each part reading, calculated shrinkage and drawing pass/fail. |
Give each measured feature its own row or linked sheet. Use the same length units for cavity and part, and write the units in the column heading. Keep the raw readings as well as the percentage. A later reviewer should be able to redo the math.
BASF’s brochure says shrinkage is normally measured after 24 hours at room temperature. This is its stated practice, not a rule for every test or end use. Write the actual time on your record. “After cooling” is too vague for a fair comparison.
Control Process Variation Without Hiding a Tool Problem

Packing, gate freeze and cooling in the same record
Packing can compensate for contraction while material can still enter the cavity. Once the gate freezes, extending the hold stage does not keep feeding that cavity. The Delrin guide discusses packing and gate-related effects on dimensions; use its recommendations within the named resin family’s scope.
Record when filling switches to packing, the hold profile and how gate seal was checked. Is the pressure hydraulic, plastic pressure shown by the press or pressure measured in the cavity? Label it. You can’t compare these values as if they were the same setting.
First check that the press can repeat the shot. Record the cushion, the melt left ahead of the screw at the end of the shot, and check the relevant press outputs. A small size shift is hard to explain if the process itself keeps changing. Stay within the current grade limits and the molder’s approved work steps.
Choose a factor to test and record the rest of the setup. Measure the same features in the same state. If you change many inputs at once, you may get a better part but still not know why. Use a comparison log with blank fields for the real trial data:
| Trial record | Reference run | Changed run |
|---|---|---|
| Grade, lot and cavity | Record identity. | Confirm what stayed fixed. |
| Factor under test | Record actual value. | Record new actual value. |
| Other process outputs | Record stable values. | Check for unintended changes. |
| Part size and shape | Record raw readings. | Use the same gauge and timing. |
| Decision | State the test question. | Record what the evidence supports. |
Mold temperature trades initial change against later drift
The Delrin and BASF guides describe the relationship between mold temperature, initial shrinkage and post-molding behavior. Within their stated systems, higher mold temperatures can allow more structural change during molding and reduce later shrinkage. This is a trend to investigate, not a universal temperature prescription for every POM grade.
Record the mold setup, cooling time and time of the size check together. A favorable first reading does not prove the part will stay in size. Check it again at the agreed later state before accepting the change.
Review wall sections, gate layout and cooling balance when some areas respond differently. These design choices affect local filling and cooling. A press change may bring one feature into tolerance while moving another out. Check both before calling the change a fix.
Bring the current grade sheet and the completed trial record to the toolmaker or molder. Ask which change can be tested within the qualified process window before deciding to alter steel. There is no general hold-pressure percentage or cooling-time reduction that this article can promise.
Separate Uniform Size Errors from Warpage and Later Drift

Uniform undersize, directional mismatch and local distortion
A short part and a bowed part are different symptoms. Use what you can see and measure to choose the next check. One shrinkage number cannot explain every fit problem.
The following is a diagnostic planning aid, not a list of confirmed causes:
| Observed symptom | Evidence to collect | Next bounded check | Decision owner |
|---|---|---|---|
| Several lengths stay undersize | Cavity sizes, grade ID and stable-run readings. | Compare allowance with repeated part readings. | Toolmaker and process engineer. |
| Along-flow and cross-flow results differ | Flow map, exact grade and both readings. | Review both data-sheet directions and local flow. | Resin and process specialists. |
| Bowing or local distortion | Free-state shape, wall sections, cooling and ejection notes. | Check shape error apart from length change. | Part designer and molder. |
| Fit changes after storage or heat | First/later readings and storage or heat history. | Repeat the check at agreed test conditions. | Quality and application engineers. |
The maker guides support checking these effects together. The matrix does not prove a root cause. Keep the drawing and raw readings. The team needs them to test a proposed cause, even if the final report says only pass or fail.
Check time, temperature and moisture before assigning cause
Illustrative scenario: A housing fits at its first check but fails to fit after heat exposure in a service test. Is the resin lot at fault? The team first records the heat history, brings the part to the agreed test state and checks the same datums again. This example gives no measured drift or proven cause.
A warm part reading includes heat effects. Further shrinkage from structural change can remain after the part cools. Moisture history can affect the comparison too. Separate these effects before calling a change post-molding shrinkage.
If cracks accompany the dimensional problem, open a separate failure investigation. The site’s POM plastic cracking guide is a related reading path; cracking alone does not prove shrinkage is the cause. Preserve failed parts and assembly observations for the responsible team.
Qualify a Grade Change Before Releasing Production

Lock grade, lot and color before comparison
Set one clear trial question: can the new grade meet the part requirements within an agreed process window? A similar flow value or family name is not enough to answer it.
Return to the proposed resin change. Write down both full grade names and the data-sheet versions used. Note any change in reinforcement, color or additives. Ask for missing data rather than borrowing a number from a nearby grade name.
Keep the resin lot record separate from the part test. A certificate of analysis, if supplied, can show the listed lot properties. It cannot prove that your housing meets its drawing. A passing trial also cannot prove that every future shipment will pass.
Agree acceptance conditions and retain the trial record
Build a release packet around the following checks:
- Identity: maker, exact grade, lot and color; current grade sheet and any supplied lot record.
- Part needs: drawing version, features that must pass, datums and mating-part state.
- Test plan: gauge, support, direction, time, temperature and storage or conditioning.
- Trial setup: tool/cavity IDs, stable press settings and observed spread in readings.
- Acceptance: size limits, shape limits and the needed fit and function checks.
- Decision: failed limits, open questions, named reviewers and approved signoff.
Agree how many parts to test and what limits they must meet with your quality team. There is no universal sample count, tolerance or capability index for every part. A shrinkage value alone cannot show process capability. That needs data from the process and a suitable gauge study.
Review the whole feature set before release. If one fit dimension passes only when another is out of tolerance, the substitution is not resolved by selecting the more favorable result. Document the conflict and assign the next trial or design review.
Keep both sets of trial records. A later team can then tell a resin change from a tool, press or test-method change. Record the decision and the open issues. A “drop-in equivalent” label without that evidence will not answer the next quality question.
POM Shrinkage Questions and the Supplier Handoff
Is there one POM shrinkage rate?
No; start with the exact grade, method and direction, then check the real part. Even similar grade names can have different entries, as the Delrin table shows. A general chart can start a tool review. It cannot set the final cavity size or tolerance.
Is calculator arithmetic enough for tool design?
No. The spacer math shows which length is used as the base and how to work back from a target. It cannot predict a hole, a restrained feature or a complex flow path. Ask the toolmaker which part readings support the allowance before approving a tool change.
Can cooling eliminate all post-molding change?
Don’t assume so; the maker guides separate mold shrinkage from later size change. Both the molding process and later exposure matter. State when the part must meet the drawing. Add a later or service-state test if the end use needs it.
What should a resin inquiry include?
Send the exact grade and color, the current grade sheet and the drawing features that matter. State the service conditions. Add the trial log, part readings and a list of missing evidence. Ask for grade-specific records; a reply to an inquiry does not approve the part or process.
For a useful next step, review POM material information and prepare the trial packet before discussing resin options. Agree the pass/fail conditions with your molder, toolmaker and quality team. Release needs a known resin, a controlled trial and evidence that the part meets its real requirements.